3.14. Own set of charts
The program can create their own set of graphs. To do this, select the menu Sets and New set or press Ctrl + A . The following window will appear:
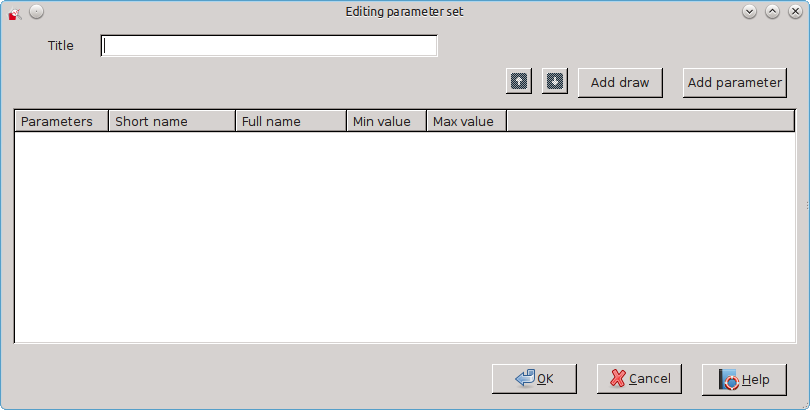
At the top of the dialog box, type the title of a new set. After pressing the Insert Chart You can insert a chart into your set of graphs. The following window will appear:
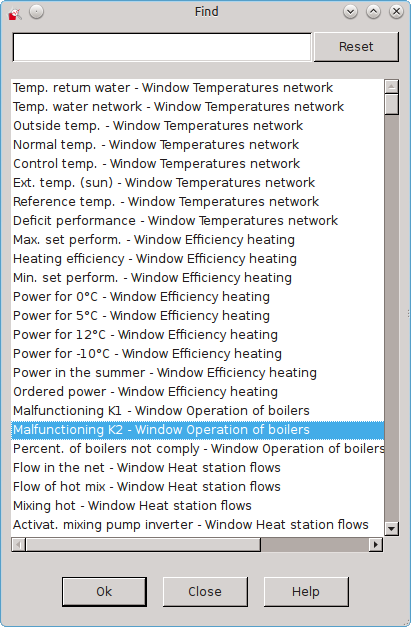
If you know the name of the chart you are looking for, you can enter it in the box above the list parameters. Thanks to this list will automatically shorten showing only the parameters with the name you entered in the string.
When you select a chart, click OK to end the search chart and add it to your own set.
You can also choose one of the self-defined parameters (adding and editing parameters - read Sekcja 3.16). For this purpose, in the " Editing parameter set " click Add Parameter . " Window opens the user parameter list " with defined by you parameters. If no parameters have been created by you, the list will be empty. In the case of a long list of parameters, you can make it easier to search by typing looking for a string in the " Search field ". The window with the defined parameters may look something like the screenshot below:
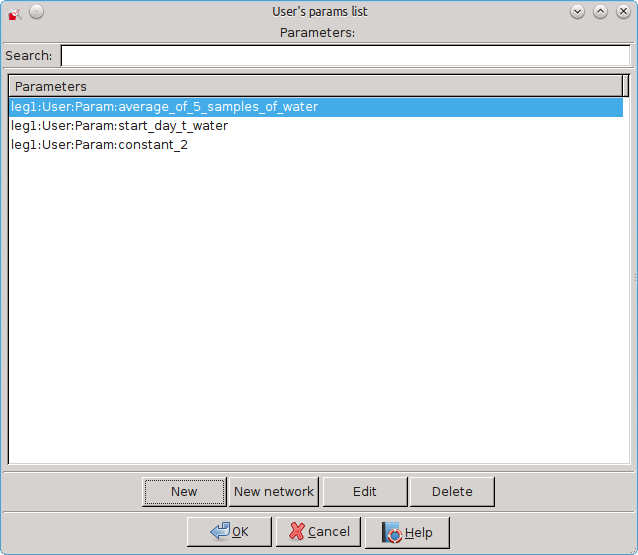
If you choose one of the self-defined parameters, click OK (or double-click on its name) to add it to your own set of graphs. Then enter the name of the short, minimum and maximum values, consider whether the value of the parameter is to be summed hourly (if so, check the box at the bottom of the window) and select a color chart display by clicking on the Select Color.
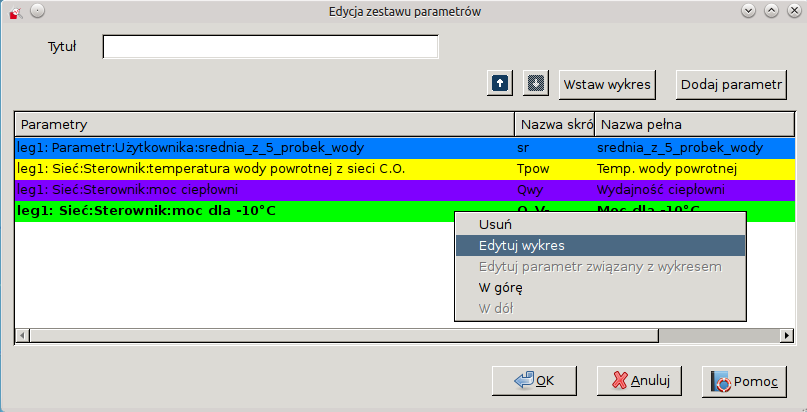
After adding a few charts to your own set, you can set the order. You can do this on two ways: click on the arrows (up or down) placed in the next button Insert Chart or right-click on a row of selected parameter and select the shift direction graph.
After right-clicking on the row of the selected parameter, you can also remove the display parameter of a set of graphs, edit the chart (color, range of value) or edit same user parameter: