3.7. Ratio window
Several sets of charts allows you to calculate the ratio of the charts. The calculation can start by choosing View and Ratio window. For calculation sets the ratio of the offering additional window is displayed, as shown in the following image:
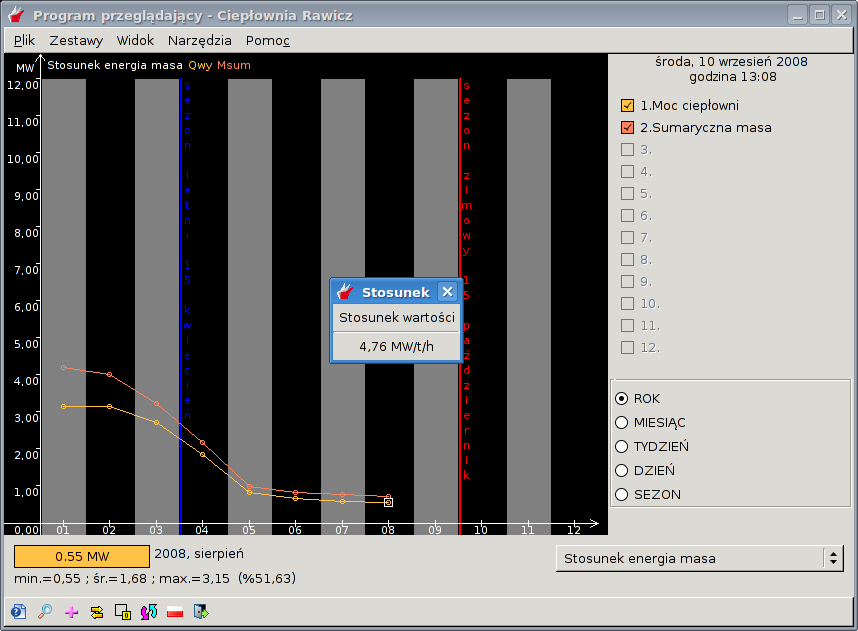
The ratio is calculated values for all samples visible in the graphs. In order to obtain relative values for different range of data, use the cursor divided into two (more on Split cursor - Sekcja 3.4).
The ratio value is calculated based on the average of the samples selected time (eg, month). You can switch between the average timing, but remember that this will leave the Split cursor mode.