3.3. Block charts
If you want to compare values from different periods of time (eg, temperature control from March to April, the reference temperature), use the function block diagram. Right-click on the title of the chart and select "Chart locked". On the set of graphs shown below is the chart locked "Temp. return":
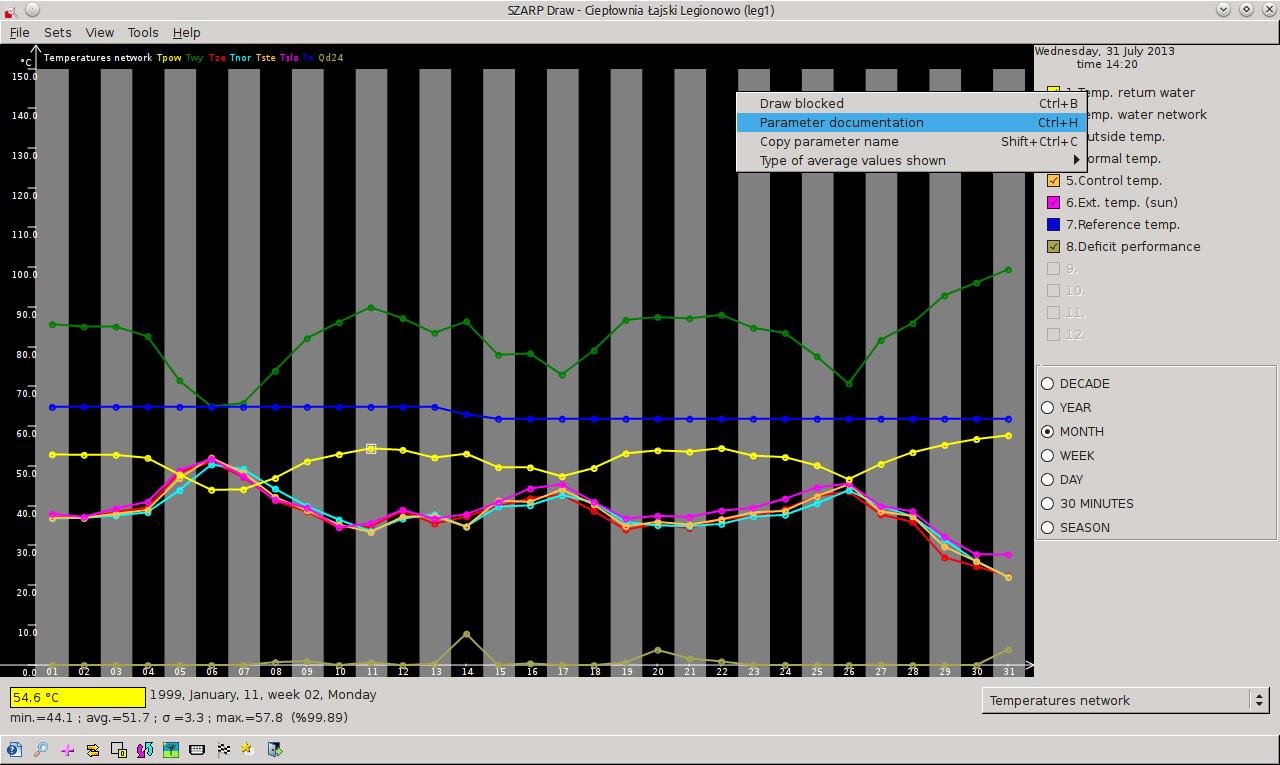
To block chart you can also use the keyboard shortcut Ctrl + B.
When you move the time from February to January, chart "Temp. Return" (marked in yellow) has not changed its position (note that the name of chart appeared locked postscript
If you block a few charts and you slide the cursor to the unlocked chart, all blocked charts will not move. When you move the cursor to the chart locked remaining graphs, including other blocked, do not move.
Block charts can also be used to compare the values on the same chart different time periods. You create your own set of parameters (more about creating your own set: Sekcja 3.14) and add to it two times the same parameter.