3.4. Split cursor
Split mode the cursor allows you to select a portion of the graph. All presented the program data - such as minimum, maximum, average and total value - will address only a selected portion of the graph.
In order to run Split cursor set the cursor at the beginning of the period that interests you.
Then turn the Split cursor - use the shortcut Backspace, choose from the menu
Tools and Split cursor or click on the icon
![]() on the toolbar.
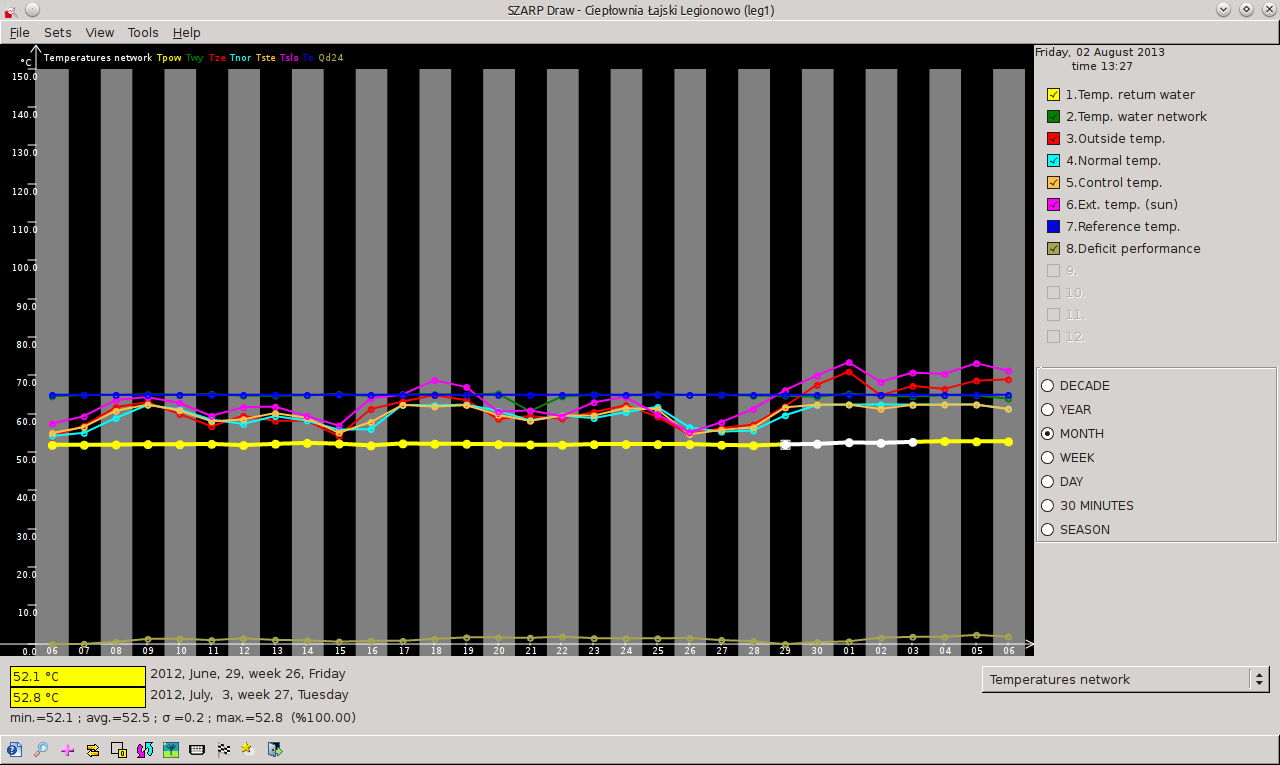
During the current Split cursor chart is bold and below the window with graphs will be a new line of data on the end of the selected period:
on the toolbar.
During the current Split cursor chart is bold and below the window with graphs will be a new line of data on the end of the selected period:
Use the arrow keys up and down you can change the chart on which the split cursor.
With Split cursor mode you can go again with one of the options to run it (ie choosing View and Split cursor by clicking on the icon on the toolbar or use the keyboard shortcut Backspace). Also, changing the type of output will average Split cursor mode.