3.5. Summary window
The program allows you to view the sum of the parameters for the selected time range. Aggregation is active only for some parameters - where it makes sense and is a physical integration is implemented as a discrete graph. For example, if we plot the boiler output (ie energy/time), the sum will show us the amount of energy produced.
Summation window for the selected set of charts turn by choosing
View and Summary window, by ckicking the icon
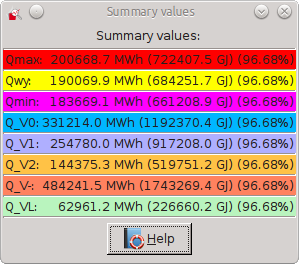
![]() on the toolbar or use the keyboard shortcut Ctrl + G. A window with the calculated sum scores, for example:
on the toolbar or use the keyboard shortcut Ctrl + G. A window with the calculated sum scores, for example:
When you move the mouse over the selected parameter in the sum will be information about the full parameter name, parameter aggregation period and the percentage of samples that contain data.
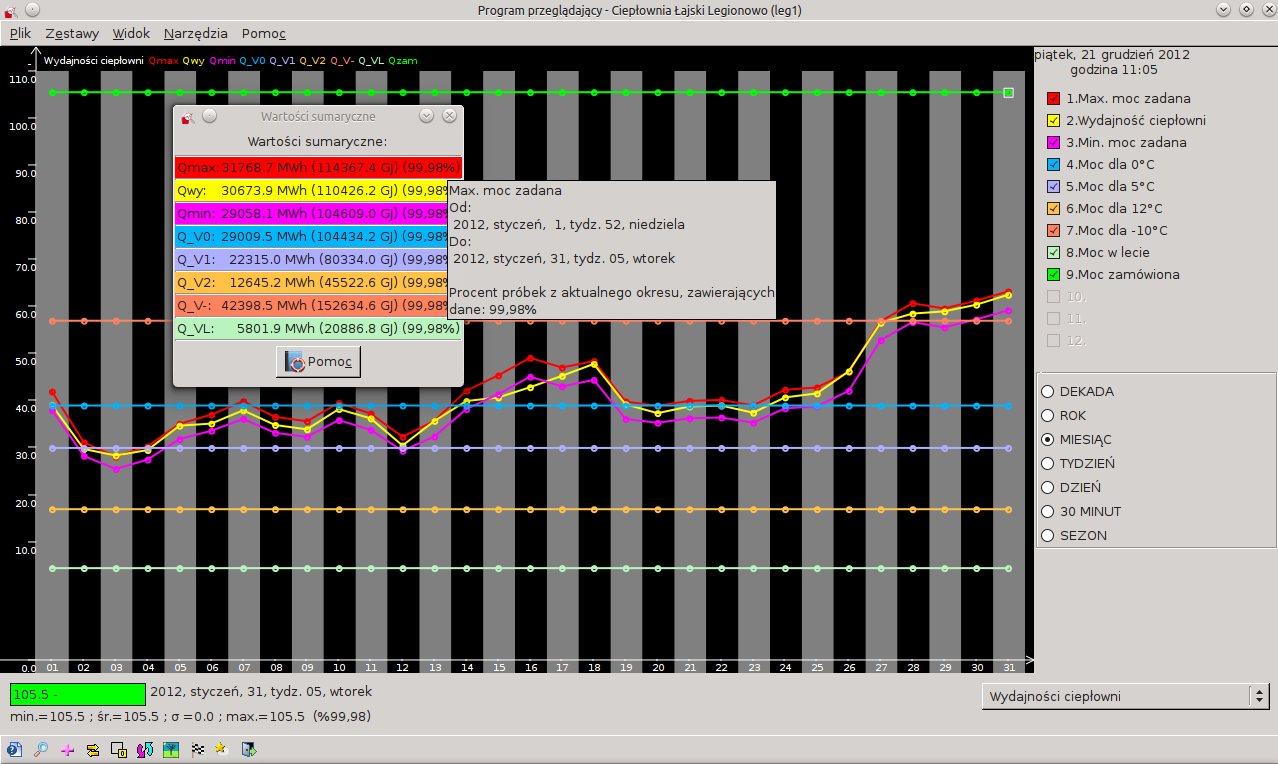
Notatka: Because the values are added together for a period of time, individuals are subject to change totalized value. For example, instead "kW" occurs "kWh", in place of "zł/h" - "zł", "MW" - "GJ", "mg/m3" - "mg/m3*h".
If there is no current set of charts, for which it can be calculated the total value, a message appears: " This window contains no charts, for which totals are calculated ".