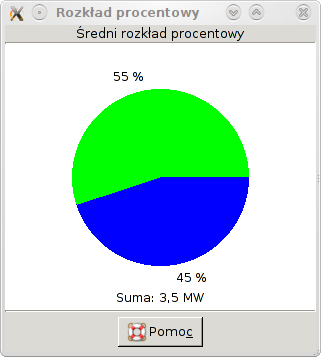
3.6. Pie window
The program allows you to view chart reading of the percentage distribution of the parameters. It is calculated on the basis of the distribution of parameter values for the selected type of medium (eg, average weekly). To view a graph of the distribution percentage, choose View and Pie window (or use the keyboard shortcut Ctrl + Alt + S). In the case where the selected set of charts can not be displayed percentage distribution of the parameters, a window with the appropriate information.