3.11. Filter
The program allows averaging of adjacent samples - filter function. Filter is used to smooth charts for easy designation trend charts by eliminating the significant changes in the instantaneous (ie peak).
Averaging is calculated separately for each sample and is described by the formula:
after using the filter value = (value of the current sample sum of n + samples before the samples in the current sample) / (2 * n + 1),where n is the degree of the filter (in the range of 0 to 5).
From this formula it follows that, for example for the filter of the first degree, the current sample value is the arithmetic mean of the sample and of a sample prior to and one occurring after the current sample.
The default level is 0 for filtering, the value of the same sample.
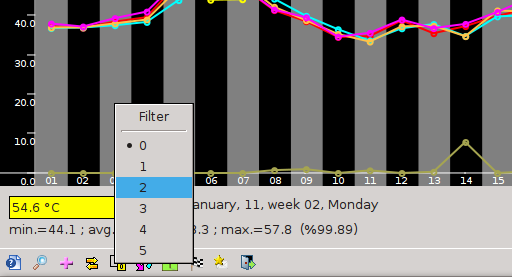
To change the filter level from the menu select Tools
Settings Filter and then the degree of the filter.
Set the filter can also be made using the keys A B C D E and F , which sets the degree of the filter, respectively, from 0 to 5
You can also change the filter settings using the icon
 on the toolbar.
To disable the filter, set the filter level on the value " 0 ".