3.10. The relationships between parameters - XYZ chart
Extension of XY charts are graphs XYZ. XYZ charts show the relationship between values of the three parameters simultaneously. For a given period of time and the average program draw3 collects three values of selected parameters for each of the points in time of the given interval (eg, for an average day will be a medium for each hour of the selected range). Yes selected three of the points in the three-dimensional space underlying the chart being built. These points are then spread on the grid 24 to 24 mesh points are points generate chart with coordinates Xo, YSR, Yo. where Xo and Zo respectively, x and z coordinates of the center of the eye, and the average value of YSR s which contain all the points in the mesh (the averaging equivalent in for the XY chart). 3D charts are two forms - point and "Surface", the chart point is one in which draw3 rysje just the chart, and the chart "plane" is a graph in which the same program in addition to the triangulation of these points draw points (at any time while watching chart you can switch between the two modes by pressing the space bar. To view a chart XYZ choose File option Chart XYZ . When selected, you will see a window to select the parameters, and the time range from which you want to retrieve the value. This window is very similar to the corresponding window for XY charts. As in the case of a two-dimensional chart, the default field values are obtained from the present system.
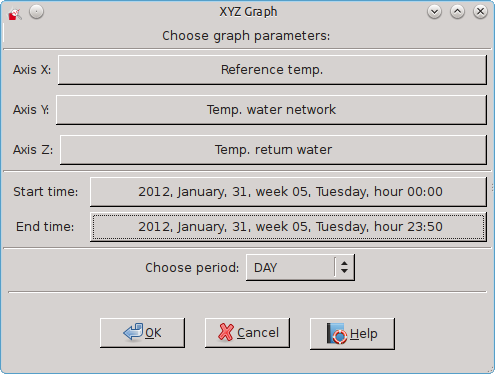
If you specify parameters and the time interval, press the OK button. This should retrieve data from the database and open graph window.
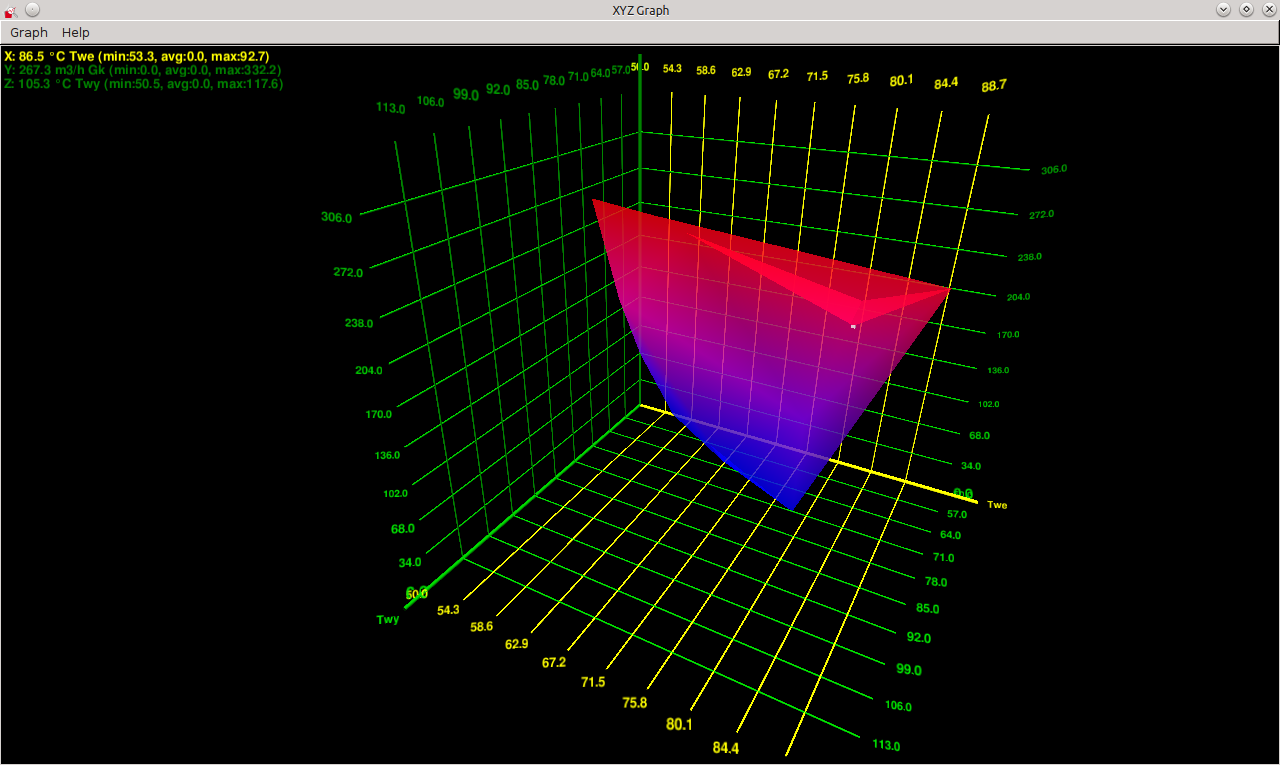
At the top of the window there is a menu Chart of options allowing you to: modify the parameters at a time graph, chart printing, print preview, page setup, closing the current window and menu Help .
Below you will find the main part of the menu window containing the relevant graph. In the upper left corner of the window is displayed akutalnej information about the cursor position. The cursor is represented on the graph as a white cube, whose position can be changed using the cursor keys. You can also make setting the cursor on a specific point, that point by clicking the left mouse key.
The chart you can move (changing the position of "point of view" of the observer) using the following keys:
w - move forward
s - move back
a - move left
d - move right
q - move up
e - ruch down
Shift + w - rotation direction of view to top
Shift + s - rotation direction of view to down
Shift + a - rotation direction of view to the left
Shift + d - rotation direction of view to the right
In addition to changing the position observer you can also rotate the graph. To rotate the graph, press and hold the right mouse button, and then start move the mouse pointer. Mouse movement in the vertical direction causes rotation of the X axis chart, and mouse movements in a horizontal direction rotation chart about the axis Y.