3.8. The average values of the parameters
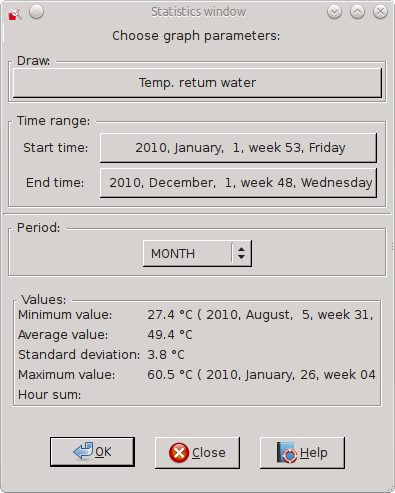
In Draw 3, you can get information about the core values of the statistical parameter. Use to the list of "Average values". It shows the average, minimum, maximum, and (if the selected parameter that makes sense) the total value of the specified period of time.
To open the window with the averages, select File and Values Medium . By default, the chart to calculate the average, will be selected first working graph of the current system. Also, by default, the time range will be set on the basis of the current system. Of course, you can change the chart and the time span before the calculations. After setting all values click OK . In the Values appear in the calculated values for a given parameter.